glTF in Unity optimization - 7. Performance Tests
This is part 7 of a mini-series.
TL;DR: Being able to check and see how changes to your code affect the performance is super helpful and fun.
I have to admit that lots of my work is not test-driven, but whenever I tests save my ass (which happened numerous times) I promise to improve.
Status Quo
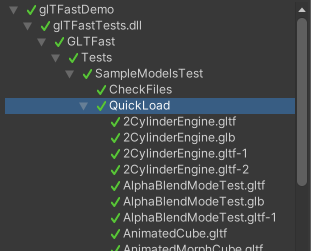
Right now glTFast has a couple of Editor and Play Mode tests. The most important ones are the "(Quick)Load" play mode tests. Given a set of sample glTF files, one test per file is created. The only set that is tested currently is Khronos' official glTF-Sample-Models (this could and should be extended to further sample files in the future).
In Unity's Test Runner window it (hopefully) looks like this:
The tests themselves only trigger loading the file, wait until it finished and check if no exceptions or error logs happened. What they do not consider is:
- The speed or duration of the loading process
- The resulting data
- The visual result
In the last post I already mentioned I need a way to automatically and systematically measure performance changes to avoid regressions and this is what the rest of this post will be about.
Checking the resulting data and the visual results will be a topic for follow-up posts.
Measuring Performance
At first I made the mistake of trying to create my own time measuring tests, only to realize that this is a lot of work (if done well). I started searching for existing solutions and quickly found the Performance Testing Extension for Unity Test Runner, a Unity package in preview.
To get started, you decorate your tests with the Performance attributes:
[Test, Performance]
public void MyTest() {...}
There's a couple of things you can measure. I for once wanted:
- Repeat test procedure ~ 10 times to even out deviations
- Warmup (run the test at least once first without capturing)
- Capture total duration
- Capture frame times
The performance tests framework offers all of these out of the box, but I couldn't find a straight-forward way to combine them all. So took care about warmup and repetition manually. Here's one of the results:
[UnityTest]
[UseGltfSampleSetTestCase(glTFSampleSetJsonPath)]
[Performance]
public IEnumerator SmoothLoading(SampleSetItem testCase)
{
    Debug.Log($"Testing {testCase.path}");
    var go = new GameObject();
    var deferAgent = go.AddComponent<TimeBudgetPerFrameDeferAgent>();

    // Set up measuring total duration
    SampleGroup loadTime = new SampleGroup("LoadTime", SampleUnit.Millisecond);

    // First time without measuring
    var task = LoadGltfSampleSetItem(testCase, go, deferAgent);
    yield return WaitForTask(task);

    using (Measure.Frames().Scope()) {
        // Repeat test `k_Repetitions` times
        for (int i = 0; i < k_Repetitions; i++) {
            task = LoadGltfSampleSetItem(testCase, go, deferAgent, loadTime);
            yield return WaitForTask(task);
            // Wait one more frame. Usually some more action happens in this one.
            yield return null;
        }
    }
    Object.Destroy(go);
}
Inspecting Results
The package comes with a brilliant, dedicated window for test inspection.
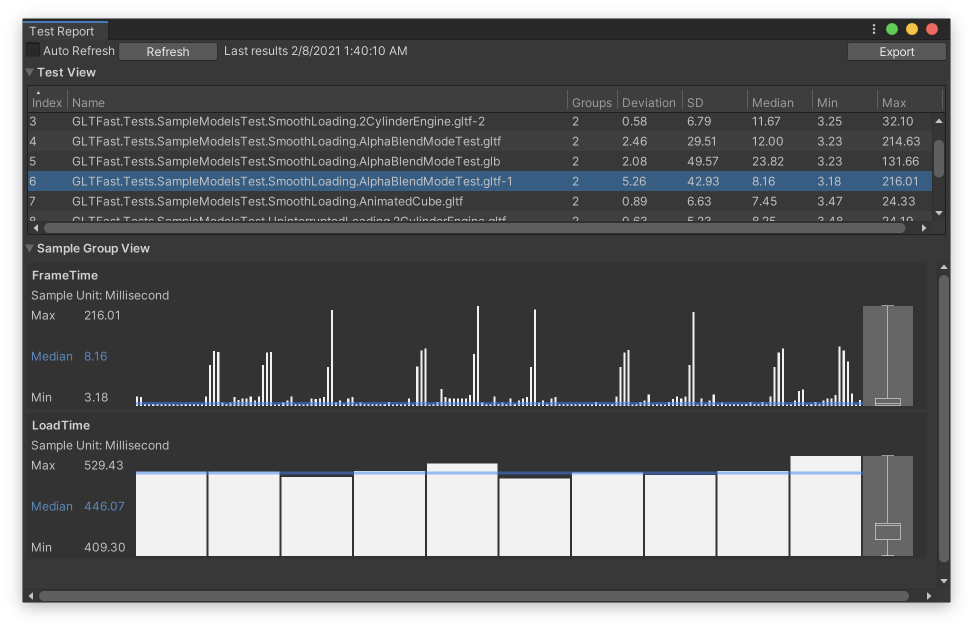
The top bar chart shows the frame times. This particular test has extreme outliers which should be investigated.
The second chart shows the overall loading times with 10 repetitions.
Comparing Results
So far this package is already very useful, but the next step is to re-run the tests after changes were made to see how the results compare. Or run the tests on different hardware or build configurations.
Performance Benchmark Reporter
The documentation refer to a tool called Performance Benchmark Reporter. It's a .NET based CLI tool that takes the output files that performance tests creates and produces an HTML page with comparison bar charts for each test. Here's how it looks like:
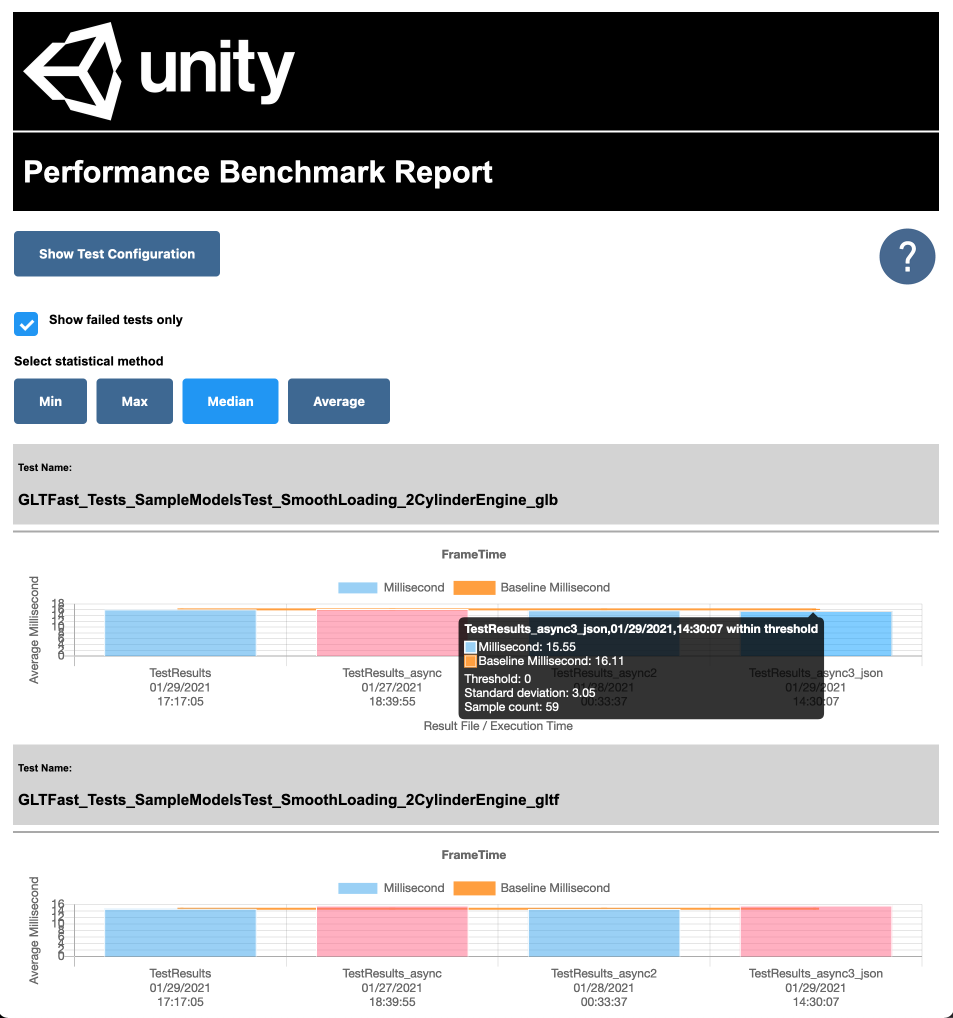
Initially I was keen on it, since it provided a solution out of the box. The more I played with it, the more flaws I found:
- It does not really give you a quick overview across all test. You have to disable "filter by failed" and scroll through results a lot to get a feel.
- It is very slow to view and react as the number of tests goes into the hundreds. Resizing the window took seconds. It uses HTML canvases to draw the charts for each test on a single (non lazy-loaded page)
- No way of filtering or sorting for total load times or frame times (those are called sample groups, in performance test speak)
- Result files have to be copied and building the page has to be triggered manually.
Custom Charts
Disappointed with the fact that I couldn't quickly make sense of all this cool results that I had gathered I thought that I could probably make some charts myself if only I had the data in a spread sheet.
Since the test data is written to disk in a JSON file I tried to quickly hack a script that does exactly that: Output the data I wanted in a CSV file that can be copy pasted into my spread sheet app of choice.
The output of the Python script allowed me to create my own charts.
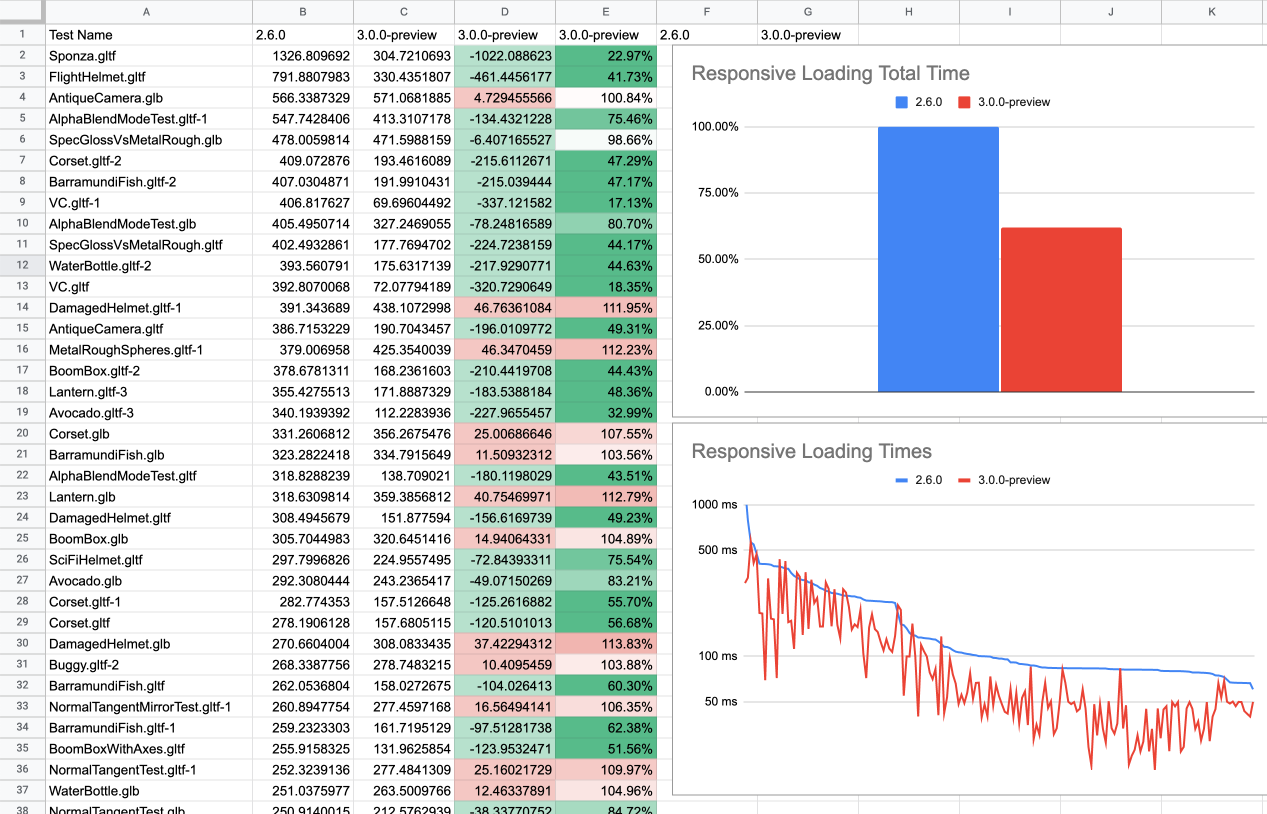
I still have to trigger the creation of CSV files and copy-paste them manually, but making and updating meaningful charts is doable now.
Putting it to use
Before I created this setup I used to compare a handful of manually selected models and watched at the total time all tests would take, which was tedious and prone to overseeing something.
Creating this kind of performance benchmark set me back a bit, but I cannot stress enough how much more fun it is to tweak performance now and seeing actual, exact results across all test files in a matter of minutes.
It helped me spot regressions already and I'm sure it will in the future.
Follow-Up
There's still a lot room to improve:
- Add more real-world and corner case glTF models to tests (e.g. high polygon models)
- Measure memory usage
- Run benchmarks on mobile and WebGL platforms (at the moment it's only Editor and standalone)
- Automate creating comparison charts (further)
- Automate running the tests
When it comes to quality assurance in general, there's even more missing pieces
- Code Coverage
- Render Tests
- Integration of all test in Continuous Integration
I hope I'll be able to push in this direction as we go. It certainly won't get boring soon.
Next
In the next post I'll try to show how the performance benchmarks helped me improve frame rate and loading speed alike.
Follow me on Mastodon or Bluesky or subscribe the feed to not miss updates.
If you liked this read, feel free to
